Courage Lives Here
75
74
A Year in Review 2012 – 2013:
Financial Statements
Statistical Report 2012/2013
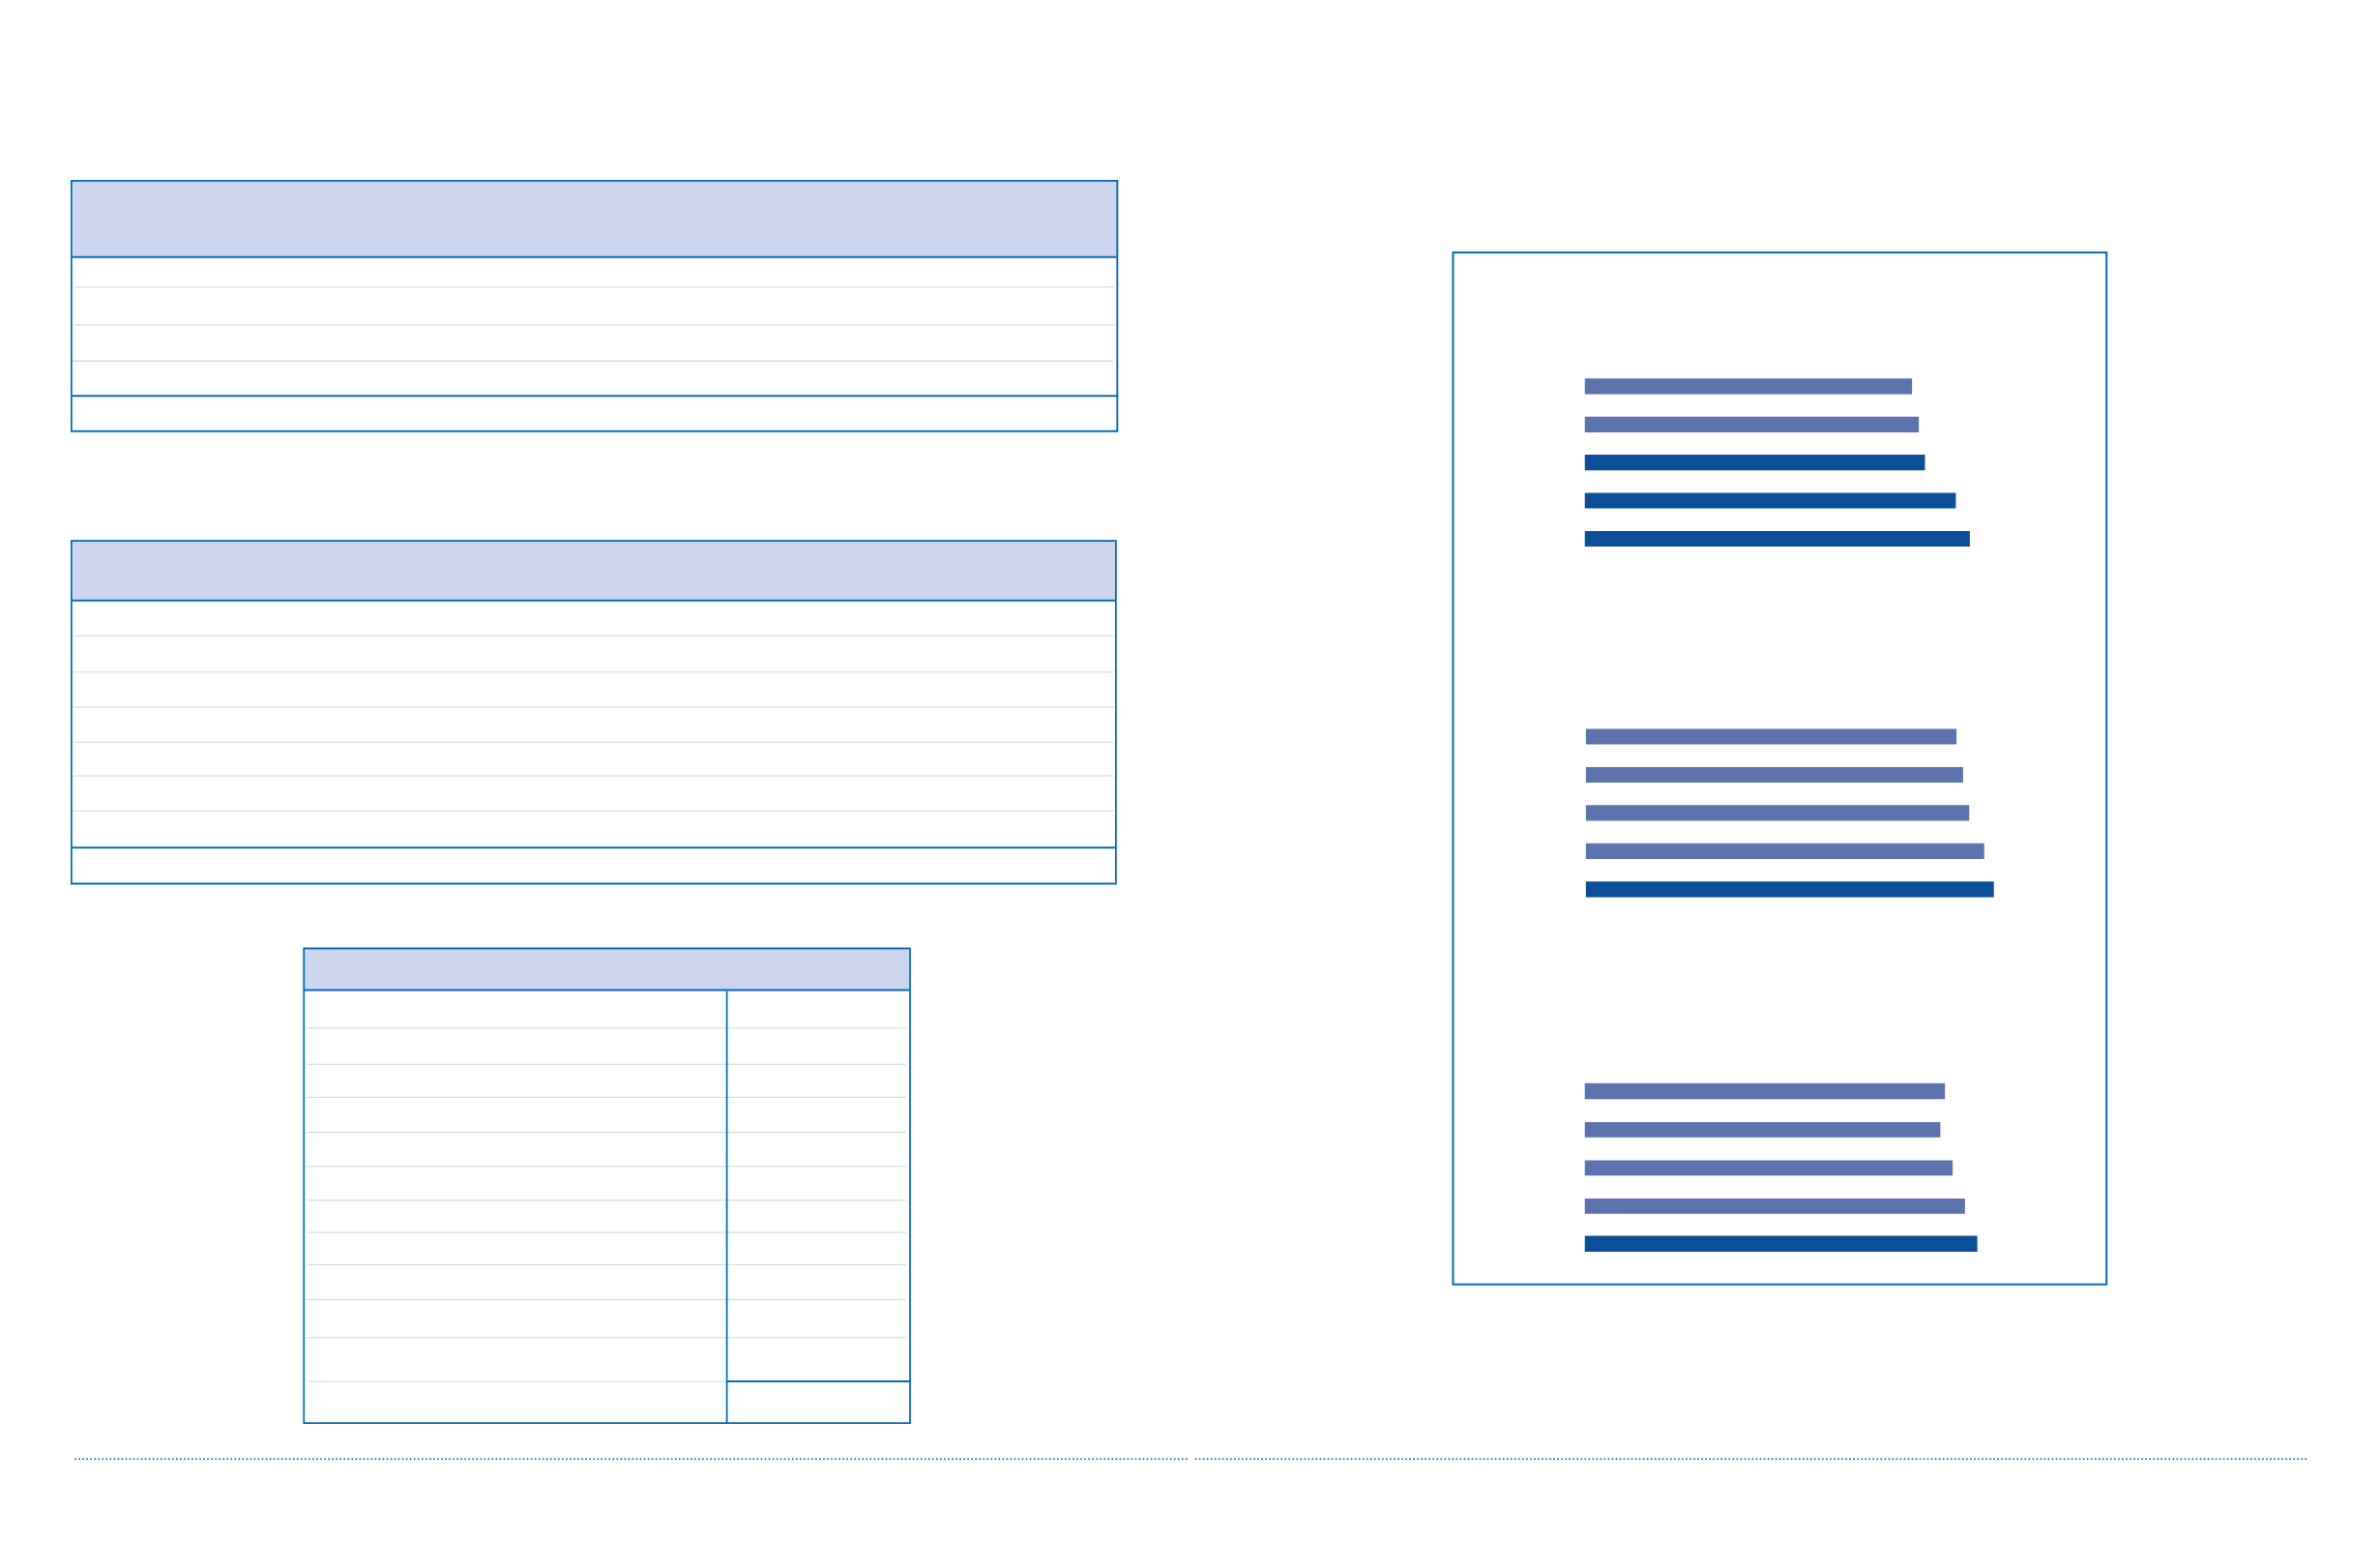
Trends Report
Site Activity
Site
TGH
TWH
PMH
TRI – Bickle Centre
TRI – University/Hillcrest Centre
TRI – Lyndhurst Centre
TRI– Rumsey Centre
UHN
416
262
124
208
158
57
1,225
143,319
91,283
43,470
65,404
50,607
19,511
413,594
235,766
403,868
262,332
3,366
28,727
7,063
51,031
992,153
43,568
59,987
103,555
Beds
Inpatient Days
Clinic & Day/Night
Care Visits
Emergency Visits
*Data is based on General Ledger for Acute,NRS for Rehab,and CCRS for CCC,PHS for Rehab & CCC Ambulatory Visits;+ 2012 HIG Grouper RIW for Acute,2012/13 grouper year for Rehab;
**2012/13 RUG III CMI Weights;~ Coding (NACRS);^ 2012 HIG Grouper 2012 RIW;`excludes radiation fractions
Program Grouping Activity
UHN
Acute
Rehab
Complex Continuing Care (CCC)
Rehab & CCC Combined
TOTAL
34,775
2,122
435
37,332
79,710
2,966
82,676
73,254
73,254
28,801
28,801
4,634
4,634
901,966
90,187
992,153
Inpatient
Separations *
Inpatient +
Weighted
Cases
CCC RUG
Weighted
Patient Days **
Day Surgery
Cases ~
Day Surgery
Weighted
Cases^
Ambulatory
Visits *`
UHN Research Activity
Medical & Community Care (MCC)
Surgical Programs and Critical Care (SPCC)
Multi-Organ Transplant (MOT)
Peter Munk Cardiac Centre (PMCC)
Princess Margaret Cancer Program (PMCP)
Krembil Neuroscience Centre (KNC)
Arthritis Program (AP)
Laboratory Medicine Program (LMP)
Joint Department of Medical Imaging (JDMI)
Toronto Rehabilitation Institute (TRI)
PI’s without program grouping assignment
2012–2013
31,029,431
25,944,667
11,137,068
19,388,108
182,311,328
20,877,934
14,810,674
5,098,976
2,226,896
13,612,469
5,037,816
331,475,367
Research Activity
Growth in Revenue
(millions)
08/09
1503
09/10
1554
10/11
1589
11/12
1832
12/13
1924
Growth in External Research Funding Awarded
(millions)
08/09
228
09/10
221
10/11
231
11/12
302
12/13
331
Inpatient and Outpatient Activity
(thousands)
08/09
1128
09/10
1144
10/11
1163
11/12
1390
12/13
1406


