
PSS
can graph any numerical values that are entered in the progress
notes section,
including patient vital signs and lab result values.
If
the numerical value is a patient vital sign, it must first be entered
in the progress notes,
using a standard category format. When graphing, the system uses
a text category that
precedes the numeric value - e.g. BP: for blood pressure,
T: for temperature, Ht: for height,
and Wt: for weight.
Option |
Description |
BP: (Blood Pressure) |
Every recorded BP reading is represented by a pair of dots – one for each value. Readings taken at different times have lines connecting them to show trends more clearly. The shaded area on the graphs represents the normal range for the blood pressure. |
Wt: (Weight) in kg Ht: (Height) in cm HC: (Head Circumference) in cm |
These are graphed like any other numerical value (see screen shot below) |
WH: (Waist/hip ratio) |
The system displays pairs of points connected by lines for each recorded measurement of the Waist/Hip Ratio (WH:). |
HR: (Heart Rate) |
This reading should be entered as the number of beats per minute, so that a patient whose heart was beating 90 times per minute would have the entry HR:90. |
RR: (Respiration Rate) |
Enter this reading as the number of breaths per minute |
T: (Temperature) |
Enter this reading in Celsius |
1. On the menu, click on View and select Show Graph.
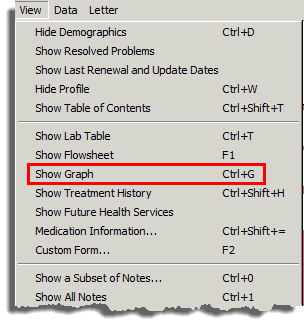
2. In
the Input box, enter the category you want to graph. In
the example below, BP was
entered. Click OK.
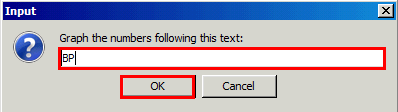
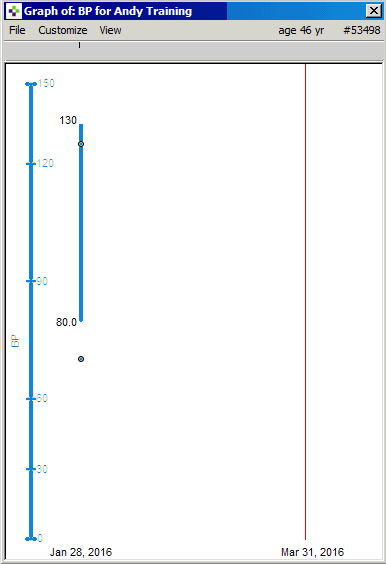
3. The Graph of BP screen will appear.
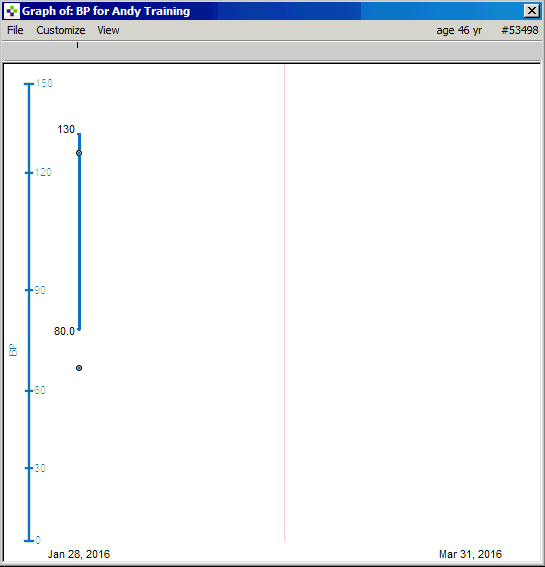
1. Once
the original graph is displayed, select CTRL + G a second
time and enter the
second category. The example below has BP
graph open and another search for WT.
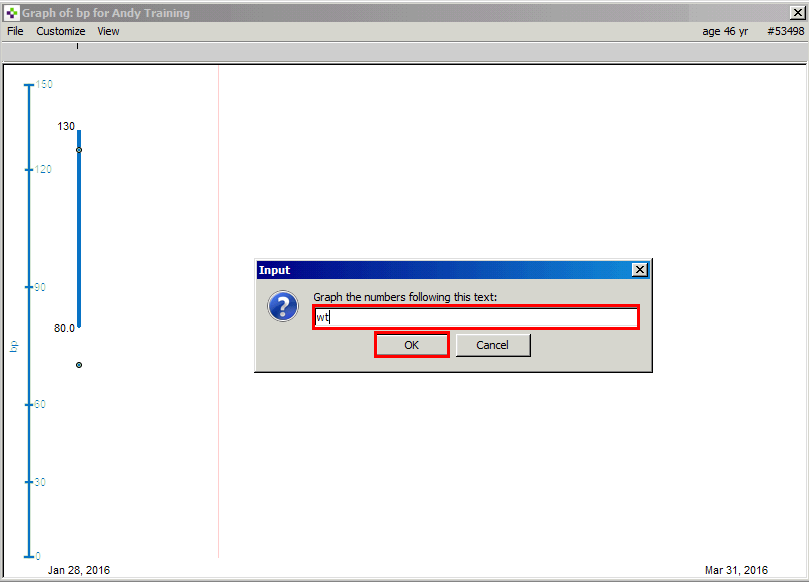
2. A
red vertical line appears that
will indicate the date from point to point as you move it across
the screen.
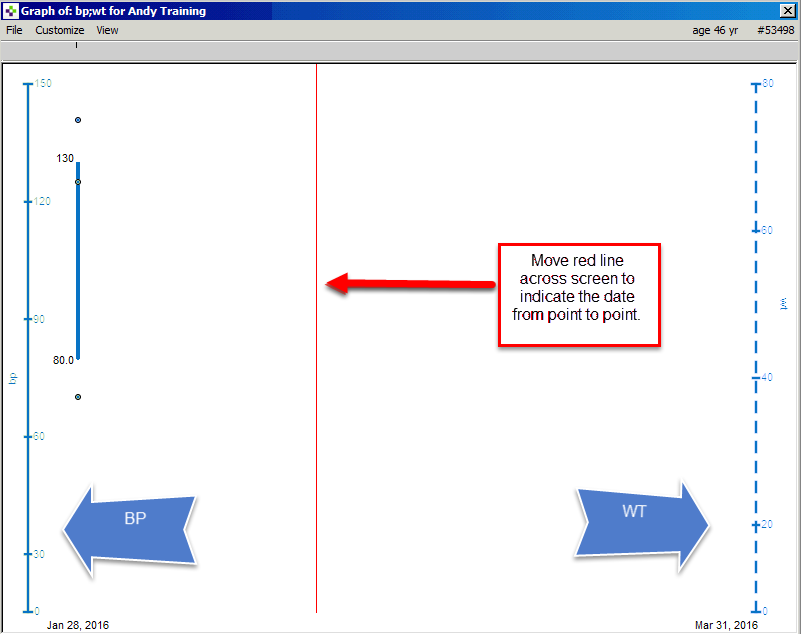
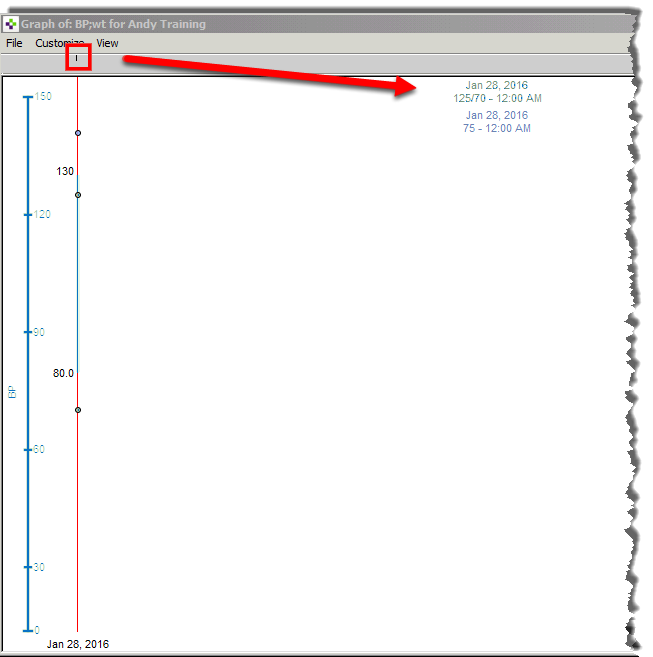
3. To see the date of the value, move the red line to the point indicated in the red box below.
1. Single-click on the desired category in the CPP toolbar.
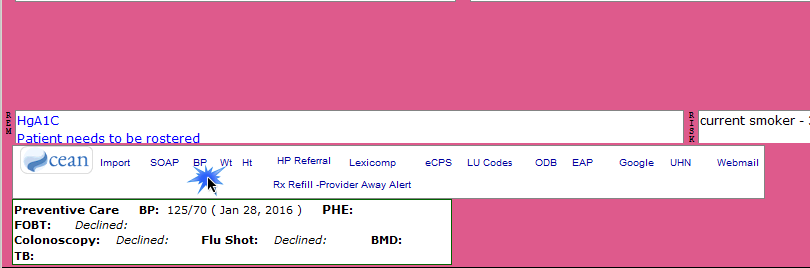
2. The graph for that category will open.

Graphs cannot be saved in the chart.
Graphs can be printed if required. From the opened graph, select
File and then print.

Learning powered by Digital Education