
Page 43 - University Health Network 2017-18 Year In Review
P. 43
Statistical Report 2017/2018 Trends Report
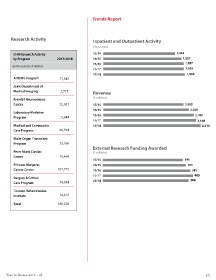
Research Activity Inpatient and Outpatient Activity
(thousands)
Program Grouping Activity
UHN Research Activity 13/14 1,464
by Program 2017/2018 14/15 1,502
Inpatient CCC RUG Day Surgery (in thousands of dollars) 15/16 1,557
Inpatient Weighted Weighted Day Surgery Weighted Ambulatory 16/17 1,555
UHN Separations * Cases+ Patient Days ** Cases ~ Cases ^ Visits *` 17/18 1,563
Arthritis Program 17,543
Acute 37,496 89,816 32,266 7,310 1,023,559 Joint Department of
Rehab 2,328 3,626 Medical Imaging 3,715 Revenue
Complex Krembil Neuroscience ($ millions)
Continuing Centre 32,037 13/14 1,985
Care (CCC) 501 64,820 14/15 2,020
Laboratory Medicine
Rehab and CCC Program 5,844 15/16 2,106
Combined 105,787 16/17 2,168
Total 40,325 93,442 64,820 32,266 7,310 1,129,346 Medical and Community 17/18 2,215
Care Program 48,394
* Data is based on General Ledger for Acute, NRS for Rehab, and CCRS for CCC, PHS for Rehab & CCC Ambulatory Visits;
+ 2017 HIG Weights for Acute, 2017 RPG Weights for Rehab; ** 2017 RUG III Grouper; ~ Coding (NACRS); Multi-Organ Transplant
^ 2017 CACS ON Weights; *`excludes radiation fractions and emergency visits. Program 15,766
External Research Funding Awarded
Peter Munk Cardiac ($ millions)
Site Activity Centre 19,460 13/14 345
Princess Margaret 14/15 355
Cancer Centre 187,772 15/16 382
Inpatient Clinic & Day/Night Emergency
Site Beds * Days Care Visits Visits Surgery & Critical 16/17 405
Care Program 34,884 17/18 380
TGH 432 154,750 368,847 52,425
Toronto Rehabilitation
TWH 274 98,891 370,297 70,153 Institute 14,815
Princess Margaret 135 46,939 284,415 Total 380,230
TRI - Bickle Centre 208 60,626 2,266
TRI - University Centre 161 53,590 40,113
TRI - Lyndhurst Centre 60 18,910 9,736
TRI - Rumsey Centre 53,672
Total 1,270 433,706 1,129,346 122,578
* Beds staffed and in operation.
42 University Health Network Year in Review 2017 – 18 43