
Page 44 - Sharpening the Focus at UHN
P. 44
Statistical Report 2016/2017 Trends Report
Research Activity Inpatient and Outpatient Activity
(thousands)
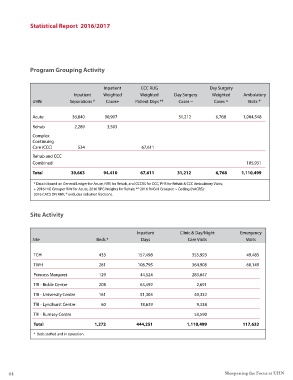
Program Grouping Activity
UHN Research Activity 12/13 1406
by Program 2016/2017 13/14 1464
Inpatient CCC RUG Day Surgery (in thousands of dollars) 14/15 1502
Inpatient Weighted Weighted Day Surgery Weighted Ambulatory 15/16 1557
UHN Separations * Cases+ Patient Days ** Cases ~ Cases ^ Visits *` 16/17 1555
Arthritis Program 19,254
Acute 36,840 90,907 31,212 6,768 1,004,548 Joint Department of
Medical Imaging 3,980 Revenue
Rehab 2,289 3,503 ($ millions)
Complex Krembil Neuroscience 12/13 1910
Continuing Centre 32,036 1985
Care (CCC) 534 67,611 13/14
Laboratory Medicine 14/15 2020
Rehab and CCC Program 6,065 15/16 2106
Combined 105,951
16/17 2168
Medical and Community
Total 39,663 94,410 67,611 31,212 6,768 1,110,499
Care Program 43,348
* Data is based on General Ledger for Acute, NRS for Rehab, and CCCRS for CCC, PHS for Rehab & CCC Ambulatory Visits;
+ 2016 HIG Grouper RIW for Acute, 2016 RPG Weights for Rehab; ** 2016 RUG III Grouper; ~ Coding (NACRS); Multi-Organ Transplant External Research Funding Awarded
2016 CACS ON RIW; *`excludes radiation fractions. Program 12,628 ($ millions)
Peter Munk Cardiac 12/13 331
Site Activity Centre 19,870 13/14 345
14/15 355
Princess Margaret 382
Cancer Centre 209,570 15/16
Inpatient Clinic & Day/Night Emergency 16/17 405
Site Beds * Days Care Visits Visits Surgery & Critical
Care Program 37,357
TGH 433 157,498 355,993 49,483
Toronto Rehabilitation
TWH 281 106,795 364,908 68,149 Institute 21,026
Princess Margaret 129 44,524 283,647 Total 405,134
TRI - Bickle Centre 208 65,492 2,691
TRI - University Centre 161 51,303 40,332
TRI - Lyndhurst Centre 60 18,639 9,338
TRI - Rumsey Centre 53,590
Total 1,272 444,251 1,110,499 117,632
* Beds staffed and in operation.
44 Sharpening the Focus at UHN Year in Review 2016 – 2017 45